Any technical system you build inevitably slides into decay as the ecosystem you’ve borrowed from upgrades slowly over time while you’re off doing other things.
The parts you custom tailored now no longer fit. Some of the suppliers go out of business. Some changed businesses altogether.
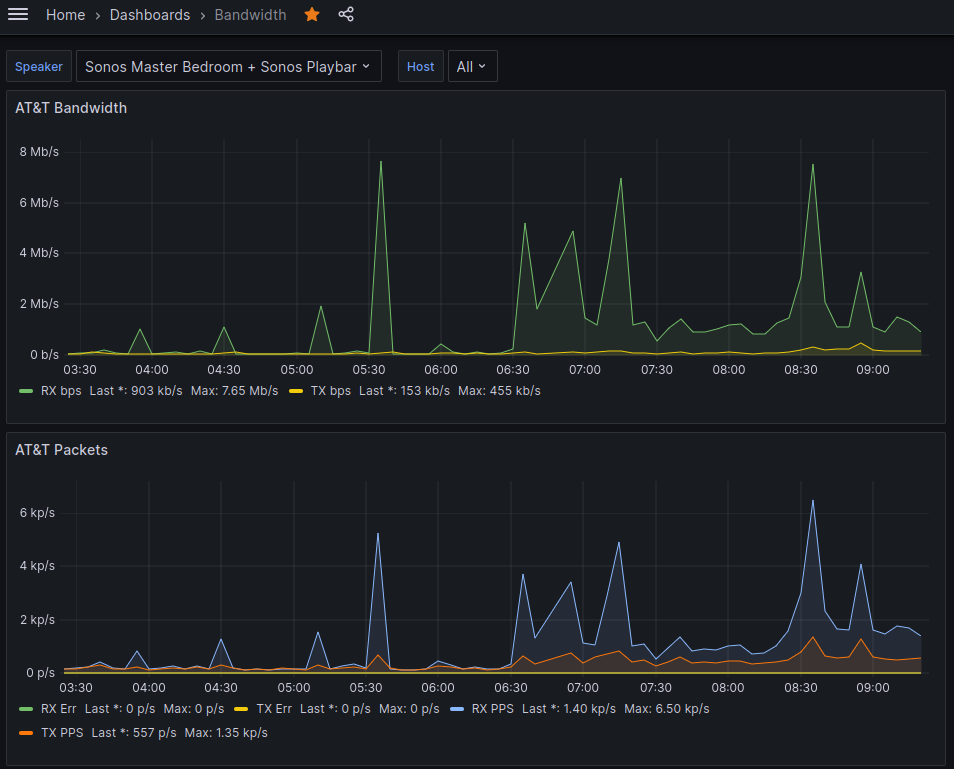
That’s where I find myself with my home network monitoring system. I created a custom system to graph my Internet bandwidth years ago (almost a decade?), and it’s been slowly falling apart. Primarily I was capturing the bandwidth utilization of my home router, but I also extended this to monitor individual Sonos speakers too. This lets me visualize how much bandwidth Pandora uses versus Spotify, for example. It’s also handy to graph packet error counts.
My Internet is from AT&T U-Verse and they provide a PACE 5628AC router. This is probably the one piece of the puzzle that is constant. It provides a web page that I can scrape with a count of TX and RX bytes, packets, and errors.
You can poll this web page and it returns an HTML page with the following table.
http://192.168.1.254/xslt?PAGE=C_1_0
<h2>Traffic Statistics</h2>
<table class="colortable">
<caption class="stealth4">IP Traffic</caption>
<thead>
  <tr>
	<th class="tablesidebold">Type</th>
	<th>Bytes</th>
	<th>Packets</th>
	<th>Errors</th>
	<th>%</th>
  </tr>
</thead>
<tr>
  <td class="tablesidebold">Transmit</td>
  <td>3334592639</td>
  <td>275629929</td>
  <td>0</td>
  <td>0</td>
</tr>
<tr>
  <td class="tablesidebold">Receive</td>
  <td>4139746827</td>
  <td>722880850</td>
  <td>0</td>
  <td>0</td>
</tr>
</table>My first solution looked like the following:
Ubuntu VM with Cacti --> Custom BASH script with curl --> Home Router web page
                 |
+-----> Custom BASH script with curl --> Sonos speaker pageCacti allowed me to call any custom polling script and as long as the script ran, and produced some STDOUT, Cacti could be setup to parse that data.
Here’s the very old BASH script for Cacti to collect AT&T network interface metrics.
Here’s the BASH script for Cacti to do the same thing for Sonos speaker network interface metrics. (Not ready yet. Can’t decide if I want a separate repo for this.)
The problem is that over time my system grew to include HomeAssistant and eventually InfluxDB and Grafana. I setup Telegraf on all of my Linux servers and was sending lots of data to InfluxDB. Grafana became my central dashboard for monitoring just about everything.
It seemed like duplicated effort to have Cacti running and InfluxDB with Grafana, but Grafana and InfluxDB had no mechanism that I could find for pulling data from my home router and Sonos speakers.
However, I was able to find the CereusTransporter plugin for Cacti, which promised to take my Cacti data and push it into InfluxDB. This was really tempting because I had spent years tweaking my Cacti config.
Now I was using something like the following:
Cacti --> Custom BASH script with curl --> Home Router web page
  |
  +-----> CereusTransporter --> InfluxDB <-- Grafana
                                   ^
                                   |
                                   +--- Telegraf on server fleet
                                   |
+--- Home AssistantThis worked fine for a few years until I upgraded my Ubuntu version which upgraded my PHP version which broke Cacti and the CereusTransporter plugin.
All of my data that Cacti was collecting was no longer being pushed into InfluxDB. Primarily that was my Internet bandwidth information, but I was also grabbing Sonos speaker bandwidth info with Cacti too!
My Grafana went dark for those devices.
I found that newer versions of the CereusTransporter plugin should work, but I’d have to upgrade my Cacti, which was non-trivial if I wanted to stick to the version that was bundled with Ubuntu. I’d have to upgrade the Ubuntu VM to STS, or manually install a newer version of Cacti. Neither of those were appealing, since I ALREADY have notes about how customized that system is with plugin folder locations. As much as I enjoy creating pets, this one was getting too much to manage.
At this point in the story, there is a tickle in the back of my mind that’s asking “Why aren’t you moving all of this to docker containers instead of modifying the base VM?” That’s certainly an interesting future project. But back to the current project.
On top of the config sprawl and upgrade mess, this VM was a little resource constrained and MySQL was taking up most of the system resources. The only purpose of MySQL on this system was for Cacti. Keep in mind this is a VM that runs on the Linux host in my office that acts as my desktop system and local email relay, because I can’t stop tinkering.
If I could eliminate Cacti, I could eliminate MySQL, free up system resources, and make my graph look a little simpler. Then maybe I could look at modern and containerized apps in the future. Here’s what a new approach might look like.
Python Script --> Home Router web page
  |
  +---> InfluxDB <-- Grafana
           ^
           |
           +--- Telegraf on server fleet
           |
+--- Home AssistantThe solution I was imagining was to convert my BASH poller from something that Cacti runs, to a Python script I run in cron. The python script would poll the AT&T router web page, then I could use an InfluxDB package in Python to send the results over to InfluxDB directly.
How hard could it be?
Well, it wasn’t impossible because I have it working now. Here’s a link to my GitHub Repo for Polling AT&T U-Verse PACE 5628AC Bandwidth and sending it to InfluxDB 1.8
In this process I learned that my solution is already out of date just as soon as I’ve started. I know that was the opening paragraph of the blog and the main problem I was setting out to solve, but maybe I’ve just discovered some software truth.
InfluxDB 1.8 appears to be end-of-life, and it took me a while to figure out that while 3.0 commercial versions are available, 2.7 is the only open source version. Seems like 3.0 community supported version would be a ways out still.
What does that mean?
- The InfluxDB client library I used above is unsupported.
- My InfluxDB database on my home server needs an upgrade at some point
- I have to determine if this will impact
- Grafana
- My servers with telegraf
- My Home Assistant
I think that’s a challenge I’m putting off for another day.
In this project, the biggest hurdle I ran into was sending over data to InfluxDB in JSON format. There are two ways to send over data, JSON and Line protocol. JSON seems like it would be VERY simple because you just build a Python dictionary, run json.dumps, and you’re off.
Line protocol seemed harder to me because I’d have to iterate through all the keys and values and build a string to send over.
However, I could not get the JSON approach to work at all.
When I built a JSON message by hand, I could get the InfluxDB client to accept it. Here’s a hand built JSON message. I literally typed this myself.
{
	"measurement": "net",
	"tags": {
		"host": "router",
		"region": "livingstone"
	},
	"fields": {
		"tx_bytes": 3713275163,
		"tx_pkts": 56434892,
		"tx_err": 0,
		"tx_pct": 0,
		"rx_bytes": 4909425,
		"rx_pkts": 109068990,
		"rx_err": 0,
		"rx_pct": 0
	}
}When I built the JSON message by dictionary, the client threw errors at me.
This is the Python body
[{'measurement': 'net', 'tags': {'host': 'router', 'region': 'livingstone'}, 'fields': {'tx_bytes': 2887133831, 'tx_pkts': 213175314, 'tx_err': 0, 'tx_pct': 0, 'rx_bytes': 1166322696, 'rx_pkts': 493634418, 'rx_err': 0, 'rx_pct': 0}}]
This is the json_body
[{"measurement": "net", "tags": {"host": "router", "region": "livingstone"}, "fields": {"tx_bytes": 2887133831, "tx_pkts": 213175314, "tx_err": 0, "tx_pct": 0, "rx_bytes": 1166322696, "rx_pkts": 493634418, "rx_err": 0, "rx_pct": 0}}]
Traceback (most recent call last):
  File "/home/burns/devel/att-scraper/get-att-bw.py", line 196, in <module>
    main()
  File "/home/burns/devel/att-scraper/get-att-bw.py", line 192, in main
    client.write_points(json_body)
  File "/home/burns/devel/att-scraper/.env/lib/python3.10/site-packages/influxdb/client.py", line 603, in write_points
    return self._write_points(points=points,
  File "/home/burns/devel/att-scraper/.env/lib/python3.10/site-packages/influxdb/client.py", line 681, in _write_points
    self.write(
  File "/home/burns/devel/att-scraper/.env/lib/python3.10/site-packages/influxdb/client.py", line 407, in write
    data = make_lines(data, precision).encode('utf-8')
  File "/home/burns/devel/att-scraper/.env/lib/python3.10/site-packages/influxdb/line_protocol.py", line 199, in make_lines
    tags = point.get('tags') or {}
AttributeError: 'str' object has no attribute 'get'When I did a character by character diff of these two approaches (hand vs python), I could not spot any differences.
So I let a month go by and then came back to it.
I debugged and read all the code of the unsupported 1.8 InfluxDB client. No progress, but I think I could figure it out by adding some debugs to my local version of the influxDB client. I decided against this deep debug approach because the client is not supported. I should just be upgrading everything. The new version of the InfluxDB client has very nice functions that would let me build points easily and I wouldn’t have to do the above.
https://github.com/influxdata/influxdb-python/blob/master/influxdb/line_protocol.py#L142
In the end I would up spending 15 minutes building the line protocol message in a really ugly way, and it worked immediately. It’s not as nice to read as the JSON, but it works! Here’s an example of the same JSON message as above, but as line protocol.
net,host=router,region=livingstone tx_bytes=3713275163,tx_pkts=56434892,tx_err=0,tx_pct=0,rx_bytes=4909425,rx_pkts=109068990,rx_err=0,rx_pct=0Here’s the terrible code to take a nice dictionary and build the above. I hate this code and could definitely do it better. I think you could loop through the measurement tags and fields and take each key and value and join them together with ‘=’ and ‘,’ where appropriate. The Influx client does this and I could probably just copy their code. But the newer library for 2.X has functions that do this for you, so I stopped when it started working. Future upgrades will make this easier and I can delete this mess.
# Now build line protocol.
# I don't like this at all.

line_body = measurement["measurement"] + \
			",host=" + measurement["tags"]["host"] + \
			",region=" + measurement["tags"]["region"] + \
			" " + \
			"tx_bytes=" + str(measurement["fields"]["tx_bytes"]) + \
			",tx_pkts=" + str(measurement["fields"]["tx_pkts"]) + \
			",tx_err=" + str(measurement["fields"]["tx_err"]) + \
			",tx_pct=" + str(measurement["fields"]["tx_pct"]) + \
			",rx_bytes=" + str(measurement["fields"]["rx_bytes"]) + \
			",rx_pkts=" + str(measurement["fields"]["rx_pkts"]) + \
			",rx_err=" + str(measurement["fields"]["rx_err"]) + \
",rx_pct=" + str(measurement["fields"]["rx_pct"])Now I just configure my config.toml file, create a crontab entry, and away I go.
I had to make some very small tweaks to my Grafana query thanks to the new field names and new Influx database I created as a data source, but it’s now alive.
Next steps are to do the same exact thing for Sonos and I can decommission Cacti and MySQL on that server.
Things I Learned
- InfluxDB measurement formats
- InfluxDB JSON and Line protocol
- InfluxDB versioning
- InfluxDB user and database creation
- Python json.dump and dumps
- TOML
- Python TOML library
- BeautifulSoup for HTML parsing
- Ok, I re-learned this. I’ve used it once long ago.
- Suppressing certificate errors in python urllib
- A tale as old as time – I imagine I’ll be ignoring cert errors on my death bed
- Walking away from a problem can be helpful when stuck